
Budget 2015 explained in 9 charts
The big action in the 2015 UK Budget comes in the moderation of public spending cuts. It doesn’t feel much like a rabbit out of a hat, but kills Labour’s charge that the ideological Tories are planning to cut public spending to its lowest level since the 1930s.
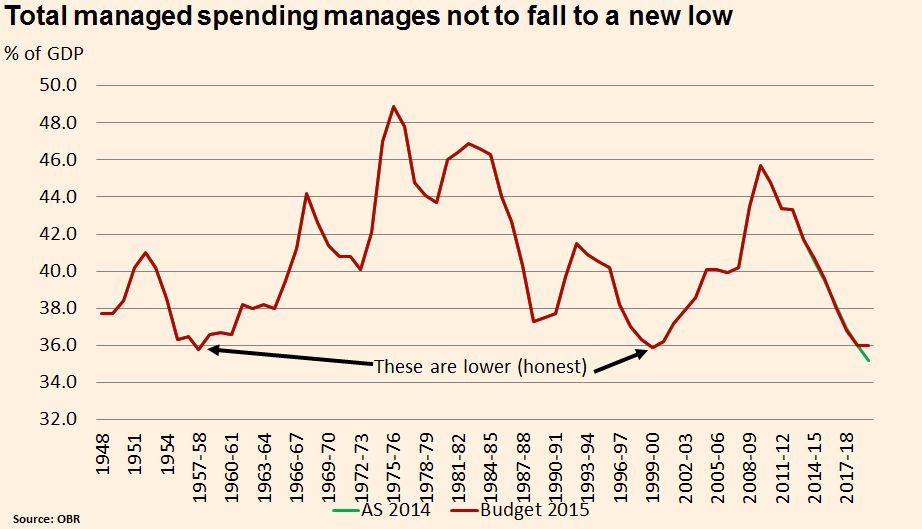
This is clear from the long run graph that total managed expenditure had been set to fall to extremely low levels (in green, the colour of the Autumn Statement). Though still true, spending now falls to a level just above the lows of 1999-00 and 1957-58.
Read more